
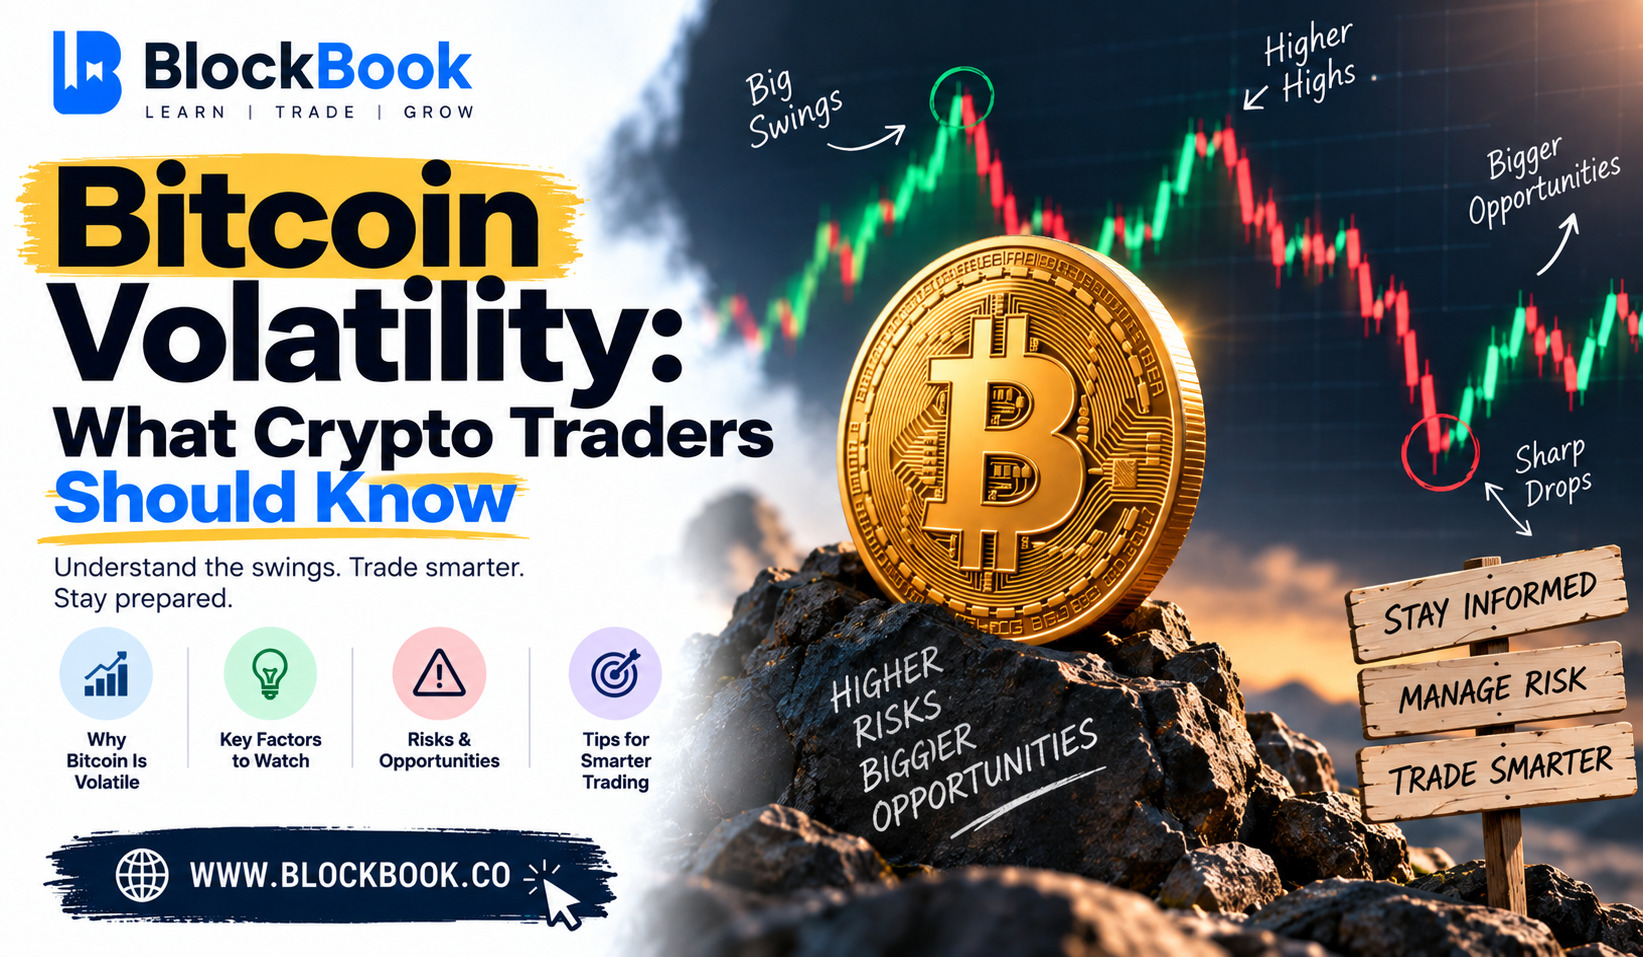
Bitcoin can move five percent in an hour and barely make headlines. That same swing in a major stock index would dominate the news cycle for days. Understanding Bitcoin volatility means understanding why these swings happen and how to trade around them, rather than being caught off guard by them.
What Volatility Actually Means
Volatility measures how much and how quickly an asset’s price moves over a given period. High volatility means larger, faster price swings. Low volatility means calmer, more gradual movement.
Volatility itself is neutral. It is not automatically good or bad. It simply describes the size of the moves a trader needs to plan around, whether those moves work in their favor or against them.
Why Bitcoin Is More Volatile Than Traditional Assets
A few structural factors help explain why Bitcoin tends to move more sharply than stocks, bonds, or major currencies.
- Market size remains smaller than most traditional asset classes, meaning large trades can move the price more noticeably.
- 24/7 trading means there is no closing bell to pause reaction to sudden news, unlike traditional stock markets.
- Sentiment-driven behavior plays a larger role, since Bitcoin lacks the earnings reports and established valuation models that anchor traditional assets.
- Relative newness as an asset class means its long-term value proposition is still being actively debated by investors and institutions.
None of these factors are permanent. Some analysts expect volatility to gradually decline as the market matures, though this remains a genuinely open question rather than a settled fact.
How Volatility Changes Across Market Cycles
Bitcoin’s volatility is not constant. It shifts depending on where the broader market sits in its cycle.
- During strong uptrends, volatility often increases as enthusiasm and trading activity accelerate.
- During sharp downturns, volatility can spike even higher, as fear-driven selling moves faster than typical buying activity.
- During quieter, range-bound periods, volatility tends to compress, sometimes for extended stretches before the next major move.
Recognizing which phase the market is currently in helps set realistic expectations for how much price movement to anticipate on any given day.
Measuring Volatility: Simple Tools Traders Use
A few common tools help traders quantify volatility rather than relying purely on a gut feeling.
- Bollinger Bands widen during high volatility and narrow during calmer periods, offering a visual read on current conditions.
- Average True Range (ATR) measures the typical size of price movement over a chosen period, giving a numeric sense of expected daily swings.
- Historical volatility comparisons against past periods can help contextualize whether current conditions are unusually calm or unusually turbulent.
None of these tools predict direction. They only describe how large the moves might be, which is still valuable information for planning trade size and stop-loss placement.
Trading With Volatility Instead of Against It
Volatility does not need to be avoided entirely. Different strategies handle it differently.
- Wider stop-losses during high-volatility periods help avoid getting stopped out by normal noise rather than a genuine trend reversal.
- Smaller position sizes during turbulent conditions reduce the impact of a single sharp move against you.
- Range-bound strategies can struggle during high volatility, since prices may break through levels that would normally hold during calmer conditions.
- Trend-following strategies sometimes benefit from volatility, since larger moves can mean larger potential gains when the trade goes as planned.
Matching your strategy to current volatility conditions, rather than using the same fixed approach regardless of the environment, tends to produce steadier results.
Managing Risk When Volatility Spikes
Sudden volatility spikes deserve particular caution, since they can move faster than a trader can react manually.
- Reduce position size when volatility is unusually elevated compared to recent averages.
- Widen stop-losses appropriately, rather than keeping the same tight stop used during calmer conditions.
- Avoid excessive leverage during turbulent periods, since liquidation risk rises sharply alongside volatility.
- Step back if needed, since sitting out an unusually chaotic period is a valid decision, not a failure to act.
Protecting capital during volatile stretches often matters more than trying to catch every single move within them.
Key Takeaways
- Volatility measures the size and speed of price movement, without indicating direction on its own.
- Bitcoin’s smaller market size and 24/7 trading contribute to sharper volatility compared to traditional assets.
- Volatility shifts across market cycles, often rising during strong trends and compressing during quieter periods.
- Tools like Bollinger Bands and ATR help quantify current volatility rather than relying on impression alone.
- Adjusting position size and stop-loss placement to current volatility conditions helps manage risk more effectively.
Frequently Asked Questions
Is Bitcoin always more volatile than the stock market?
Generally yes, though the gap can narrow or widen depending on conditions in both markets at a given time.
Does high volatility mean a trend is about to reverse?
Not necessarily, high volatility can accompany the continuation of a strong trend as easily as a reversal.
What is Average True Range used for?
ATR measures the typical size of price movement over a chosen period, helping traders gauge expected daily swings.
Should position sizes change during volatile periods?
Yes, many traders reduce position size during unusually volatile conditions to limit the impact of a single sharp move.
Will Bitcoin’s volatility decrease over time?
Some analysts expect volatility to gradually decline as the market matures, though this remains an open question rather than a certainty.
Conclusion
Bitcoin volatility is not something to avoid entirely, but something to plan around deliberately. Understanding why Bitcoin tends to move more sharply than traditional assets, how volatility shifts across market cycles, and how to adjust position sizing and stop-losses accordingly gives traders a more realistic and sustainable way to operate in a market defined by sharp, sometimes sudden, price swings.
About the Author