
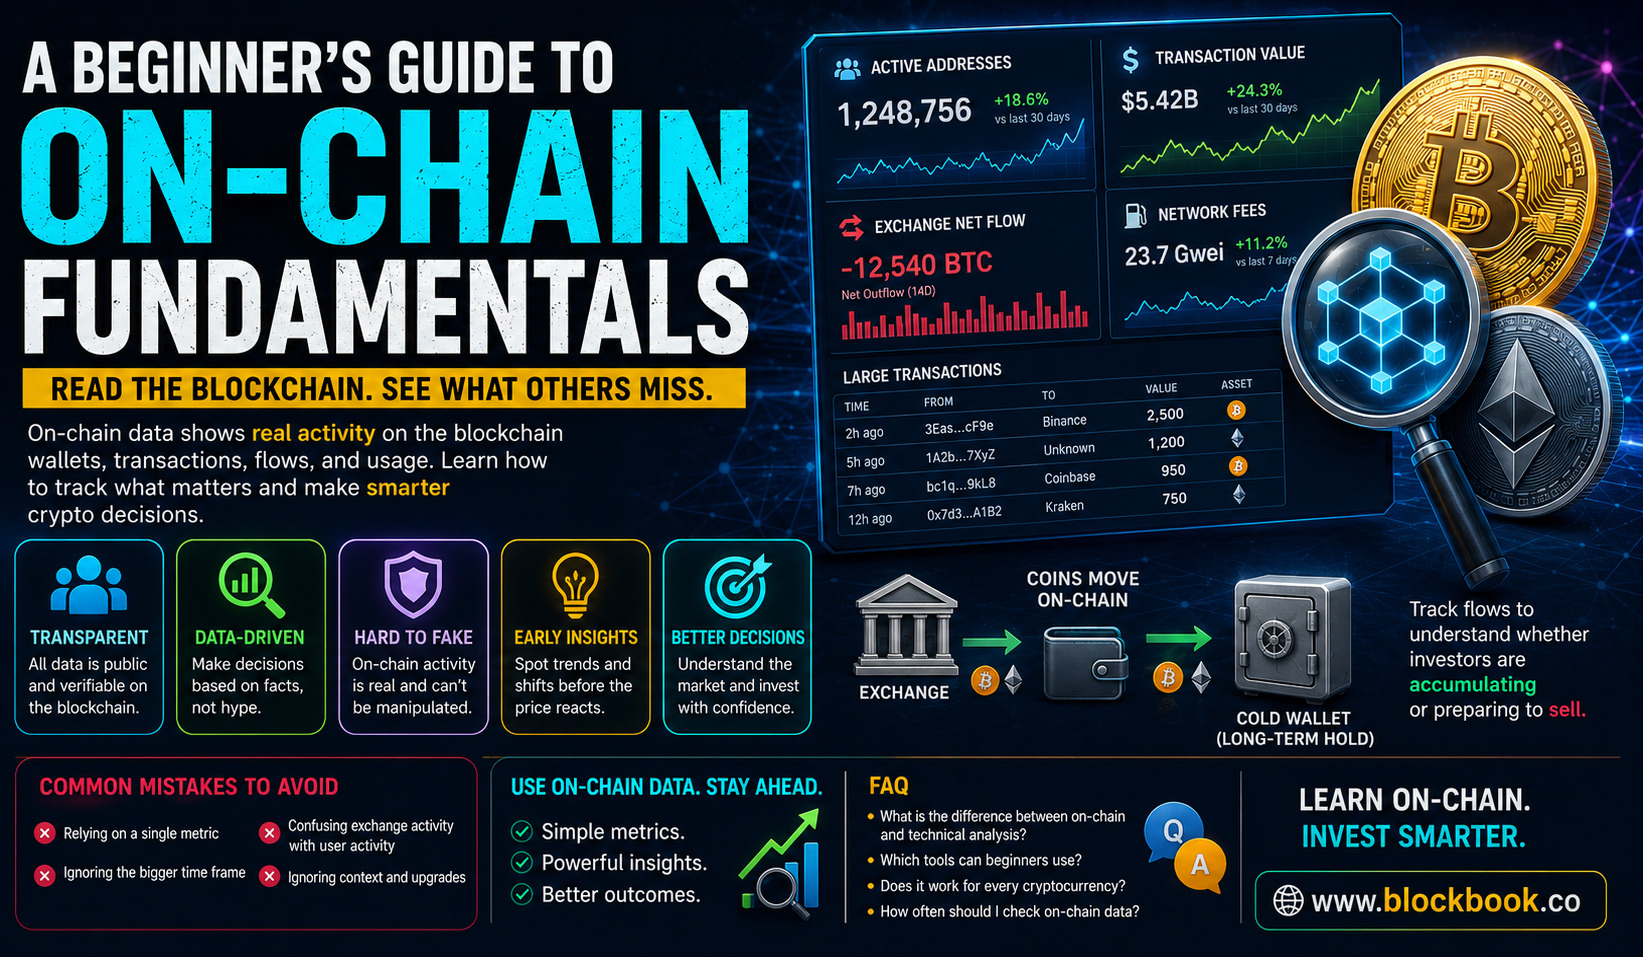
In 2021, a wallet moved 20,000 BTC to an exchange three days before a major sell-off, and on-chain analysts spotted it in real time while everyone else was still staring at candlestick charts. That’s the entire point of learning on-chain fundamentals: the blockchain tells you what’s actually happening before the price catches up. If you’ve ever bought a coin because it “felt right” and then watched it crash, this guide is for you.
On-chain fundamentals are the raw, verifiable data points recorded directly on a blockchain, things like wallet activity, transaction counts, and how coins move between addresses. Unlike a company’s quarterly earnings report, this data updates every block, is public, and can’t be faked by a marketing team. Once you know how to read it, you stop reacting to hype and start reacting to actual behavior.
What are on-chain fundamentals, really?
Think of a blockchain as a glass box. Every transaction, every wallet balance, every fee paid gets recorded permanently and is visible to anyone with a block explorer. On-chain fundamentals are simply the meaningful patterns you pull out of that glass box.
This is different from technical analysis, which looks at price and volume charts, and different from traditional fundamentals like a company’s revenue or debt. On-chain fundamentals measure the health of the network itself: who is using it, how much they’re using it, and whether real economic activity is happening or the whole thing is just speculation bouncing between traders.
A simple way to picture it: technical analysis is watching the scoreboard, on-chain fundamentals is watching what the players are actually doing on the field.
Why on-chain metrics matter more than price charts
Price can be manipulated in the short term. A whale can pump a thin order book, influencers can hype a token, and a chart can look bullish for reasons that have nothing to do with the underlying project. On-chain metrics are harder to fake because they reflect actual network usage, not sentiment.
During the 2022 bear market, Bitcoin’s price kept sliding, but a chunk of long-term holders kept accumulating instead of selling, something visible directly through wallet-age data on-chain. Traders who only followed price missed that signal completely. Those tracking on-chain metrics saw accumulation happening while headlines screamed panic.
That gap between what price shows and what the chain shows is exactly why blockchain data analysis has become a standard part of serious crypto research, not a niche hobby for developers anymore.
The core on-chain metrics every beginner should track
You don’t need to learn twenty different indicators on day one. Start with these four, and you’ll already be ahead of most retail traders.
Active addresses. This counts how many unique wallets sent or received a transaction in a given period. Rising active addresses usually means more people are actually using the network. A falling count while price stays flat or rises can be a warning sign that growth isn’t organic.
Don’t treat this number in isolation, though. Exchanges and bots can inflate address counts, so always check it alongside transaction value, not just transaction count.
Transaction volume and value. This tells you how much economic value is actually moving through the network, not just how many transactions occurred. A network with millions of tiny transactions but low total value might just be spam or dust transactions rather than genuine adoption.
Look at the trend over weeks and months rather than a single day. One large transaction from an exchange rebalancing its wallets can spike the number and mean absolutely nothing about real demand.
Exchange inflows and outflows. When coins move onto exchanges in large amounts, it often signals holders preparing to sell. When coins move off exchanges into private wallets, it often signals accumulation and long-term conviction. This is one of the most watched on-chain metrics because it directly hints at supply pressure.
A few things worth tracking here: sudden large inflows from wallets that had been dormant for years, consistent outflow trends over multiple weeks rather than a single spike, and whether the inflow is coming from one whale or spread across many wallets. Any one of these alone isn’t a signal. Together, over time, they build a picture.
Network fees and gas usage. Rising fees paired with rising usage generally means demand for block space is genuinely high. Rising fees with flat or declining usage can point to congestion problems or inefficiency rather than health. On Ethereum specifically, gas usage patterns have historically given early hints about NFT mints, DeFi activity spikes, and periods of speculative frenzy well before the broader market noticed.
Reading holder behavior: whales, diamond hands, and distribution
Not all wallets are equal, and this is where the research gets genuinely interesting instead of just being spreadsheet work.
A “whale” is a wallet holding a large amount of a given asset relative to total supply. When a handful of whales control a huge percentage of supply, price becomes fragile, because one decision from one wallet can move the market. It’s similar to a small business where one client accounts for 40% of revenue: everything looks fine until that one client walks away, and then the whole model is exposed.
Holder distribution data lets you see how concentrated or spread out ownership actually is. A token where the top 10 wallets hold 70% of supply behaves very differently from one where ownership is spread across thousands of addresses. Beginners often skip this step entirely and pay for it later during a sharp, unexplained dump.
Coin age and dormancy data is another underused tool. When coins that haven’t moved in years suddenly become active, it’s worth paying attention. It doesn’t automatically mean a sale is coming, but it’s a flag worth investigating rather than ignoring.
Common mistakes beginners make with blockchain data analysis
Everyone gets this wrong at first, so don’t feel bad if some of these sound familiar.
Treating one metric as gospel is a common trap. No single number tells the full story; a spike in active addresses without a corresponding rise in transaction value is often noise, not signal. Ignoring the time frame is another: daily on-chain data is noisy and reactive, while weekly or monthly trends give a far more honest picture of what’s actually happening. Beginners also confuse exchange activity with retail activity, when big inflows are sometimes just an exchange reorganizing its own cold storage rather than users preparing to sell. It’s easy to skip the context around network upgrades too, and a sudden shift in gas fees or transaction counts right after a protocol upgrade is often mechanical, not behavioral. And a lot of people forget to cross-reference the project’s actual roadmap; on-chain data tells you what’s happening, but knowing why usually requires reading the project’s own updates alongside the numbers.
Most of these mistakes come from wanting a single clean answer. On-chain fundamentals rarely give you that. They give you a weight of evidence, and you build conviction from multiple data points pointing the same direction.
Building a simple on-chain fundamentals checklist
Once you have the basics down, a repeatable process saves you from second-guessing every chart you see. A simple weekly routine might look like this:
- Check active address trend over the past 30 days
- Compare transaction value against the prior month
- Review exchange net flow (in versus out) over the past two weeks
- Note any unusual dormant-wallet activity
- Cross-check fee trends against known upgrades or events
Running through this list takes maybe fifteen minutes once you get used to the tools, and it filters out a huge amount of noise from social media hype cycles. Over time you start to notice which metrics matter most for the specific assets you follow, since a Layer 1 blockchain and a DeFi token don’t behave identically.
FAQ
What is the difference between on-chain fundamentals and technical analysis?
Technical analysis studies price and trading volume patterns on a chart. On-chain fundamentals study actual blockchain activity, such as wallet behavior, transaction value, and network usage. Many experienced investors use both together rather than picking one over the other.
Which tools do beginners use to check on-chain metrics?
Free block explorers let you look up individual wallets and transactions manually. Dedicated on-chain analytics platforms package this data into charts and dashboards, which is usually easier for beginners than reading raw blockchain data directly.
Do on-chain fundamentals work for every cryptocurrency?
They work best for networks with meaningful transaction activity and a long enough history to establish trends. Very new or very low-volume tokens often don’t have enough on-chain data yet for the analysis to be reliable.
How often should I check on-chain data?
Weekly is usually enough for most long-term investors. Daily checking tends to create noise-driven decisions, since short-term spikes are common and often meaningless on their own.
About the Author